

Founder’s Playbook
Data Visualization
As attention has shifted toward digital, visual, and skimmable content, many organizations found that even their strongest research was no longer landing as intended. Dense text struggled to compete with feeds, headlines, and images. This work helps social-change organizations translate complex data into compelling visual systems—using infographics, graphics, and imagery that communicate clearly, quickly, and with substance.
Strategy by Robert Espinoza; design by RD Design and The CareWorks Project for SAGE – Advocacy & Services for LGBTQ+ Elders and A Question of Care, with images courtesy of SAGE.
Designing What Comes Next
-
We live in a visual-first world, full stop. Over the past two decades, how people consume information has fundamentally changed. Audiences now encounter content online, scan headlines and sections, and rely on visuals to grasp meaning quickly. Narrative-heavy reports—once the gold standard—no longer match how most people read, share, or engage.
Organizations needed a way to communicate rigor without losing attention.
-
Designing for how people read. Across multiple organizations, Robert Espinoza helped leaders see why text-heavy publications were no longer landing—and how to adapt. The work reframed publications as reader experiences, not repositories of information.
Teams were guided to prioritize skimmability, visual hierarchy, and clarity, while expanding their understanding of what a publication can be in a digital-first, visual environment.
-
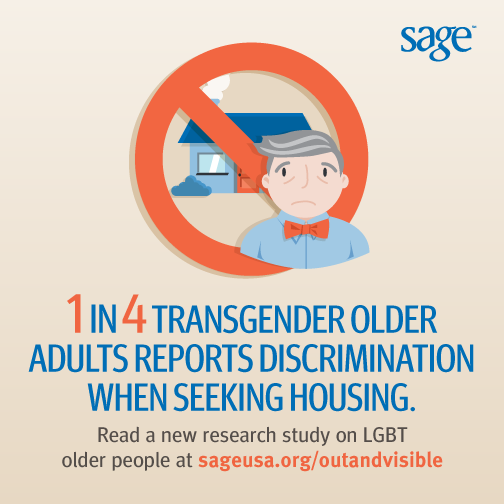
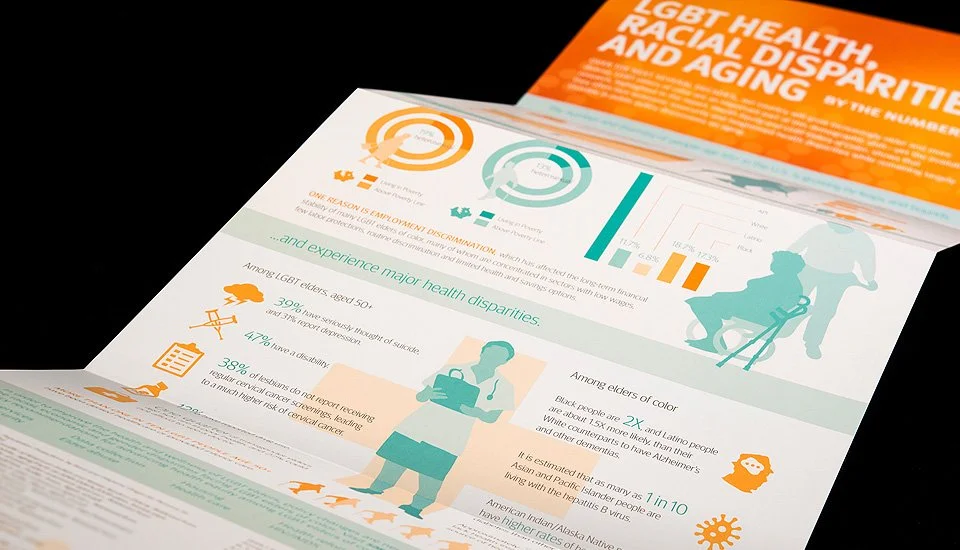
Information designed to be seen—and understood. At a time when attention is scarce and long-form reading is declining, this work transformed complex data into compelling visual systems that communicate at a glance. Under Robert’s leadership, reports and materials balanced narrative with strong data visualization—using infographics, charts, posters, social graphics, and animation to translate evidence into clear, intuitive images. Working closely with designers, each visual was crafted to carry meaning on its own while reinforcing a coherent story across formats.
Over time, these visuals became central to how ideas traveled. Infographics and graphics were shared widely across digital platforms, reused in presentations and advocacy, and cited in media coverage—helping audiences grasp complexity quickly and retain key insights. Similarly, clients gain more than attractive design: they gain visual tools that cut through noise, communicate substance without oversimplifying, and turn data into understanding that moves people to engage and act.

“For nearly a decade, Robert Espinoza has been one of the best partners my team and I could ask for. His deep expertise in caregiving and sharp understanding of policy and narrative help us create branding and communications that drive meaningful progress.”
— Matt Schwartz, Founder and Chief Brand Officer of Constructive, a leading social impact branding and communications firm that helps nonprofits and foundations drive meaningful social change.


Meet the Founder
Robert Espinoza is a nationally recognized workforce and care economy strategist and CEO of The CareWorks Project, partnering with leaders to redesign long-term care systems so people live with dignity, workers thrive, and communities prosper.